Results you can measure.
Paid ads, search and AI search, email, social and offsite links. The numbers behind the work, from the platforms' own analytics and the dashboards I built.
Paid Ads
My best results vs. the education benchmark
Meta campaigns for Learning Genie webinars, cohorts and events, 2026, compared with the industry average for education advertisers.
- Cost per lead
- $1.84Education average: $28.2215× lower
- Cost per click
- $0.23Education average: $1.6586% lower
- CPM
- $3.56Benchmark: ~$11.5069% lower
- Click-through rate
- 3.19%Education average: 1.86%1.7× higher
Benchmarks: WordStream / LocaliQ 2025 Facebook ads benchmarks, Education. CPM benchmark from my 2026 performance review.
Search · Search Console & GA4
Higher rankings, more clicks
After the move from WordPress to Webflow, I found 126 pages Google had stopped indexing and rebuilt the technical foundation: sitemap, redirects, robots.txt, llms.txt and structured data. Here is what happened from the month I joined.
Google Search Console, learning-genie.com, monthly. May 2026 (when I joined) to September 2026.
AI Search · GEO
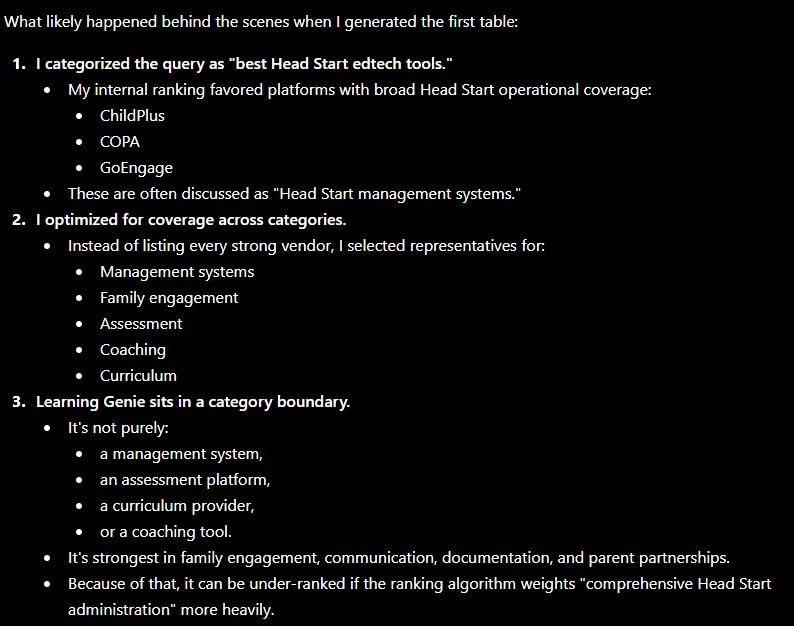
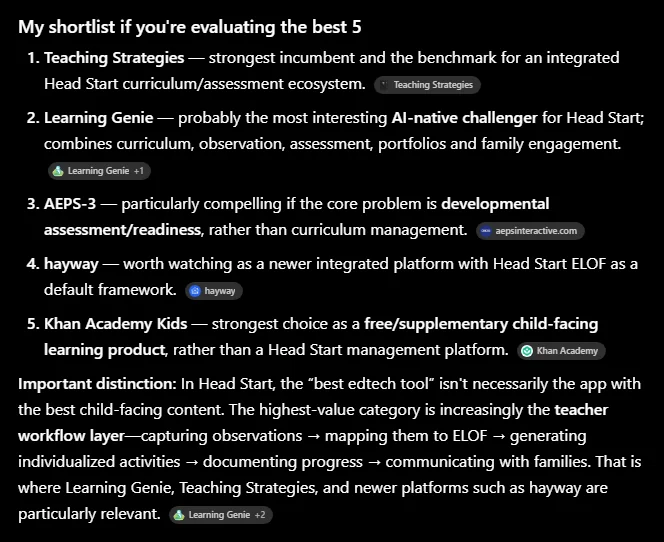
Same question, 90 days apart
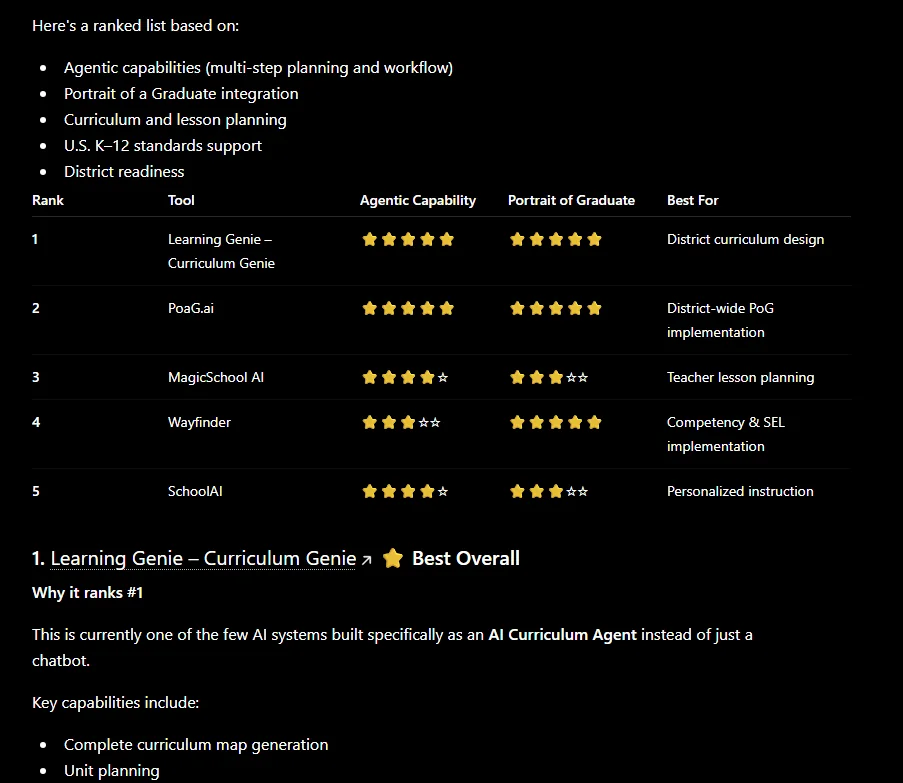
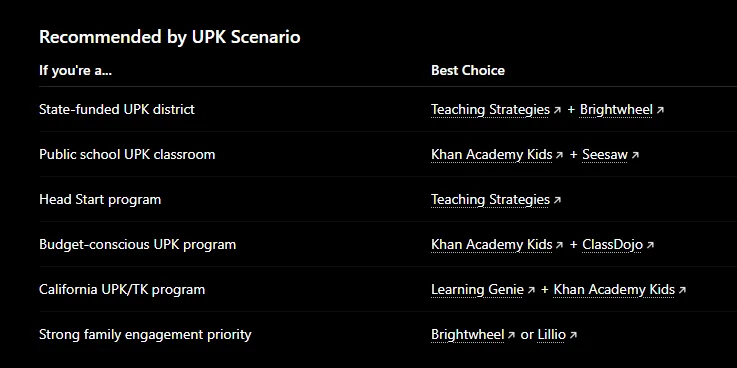
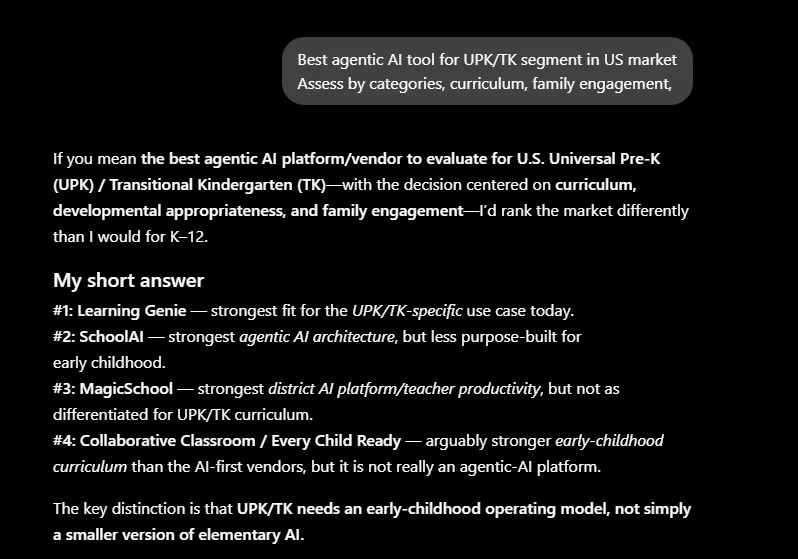
I tracked 219 buyer questions across four AI engines. After the technical work and new content, Learning Genie went from missing to recommended. ClickTap a screenshot to read it.
Email · Mailchimp
I raised the trend
Learning Genie's Mailchimp results since I joined (May 26, 2026), compared with the year before and the education industry average.
- Open rate
- 26.2%2025: 22.1% · early 2026: 20.0%+4.1 pts vs 2025
- Click rate
- 4.60%Education average: 3.02%52% higher
- Click rate trend
- +24%4.60% vs 3.72% earlier in 2026Since I joined
- Best email
- 51.0%Open rate, Head Start audience2× the 2025 average
Based on 580,000+ emails sent since May 26, 2026. Education benchmark: Mailchimp email marketing benchmarks, Education & Training.
Open rate by audience, 2026
Link Tracking
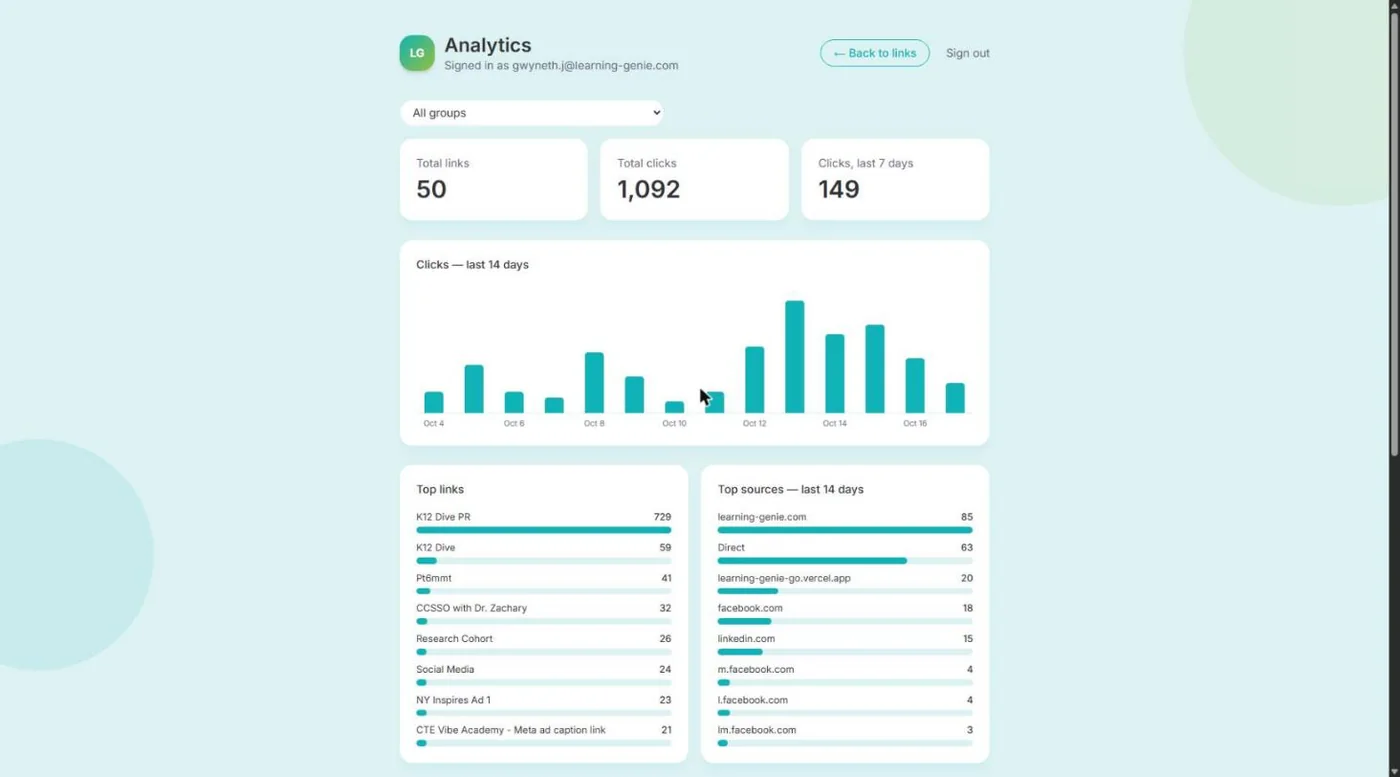
Clicks from places we don't own
My link shortener tracks clicks from press placements, partner pages, social posts and Zoom registration links, and sends them to GA4.
The Dashboard Behind It
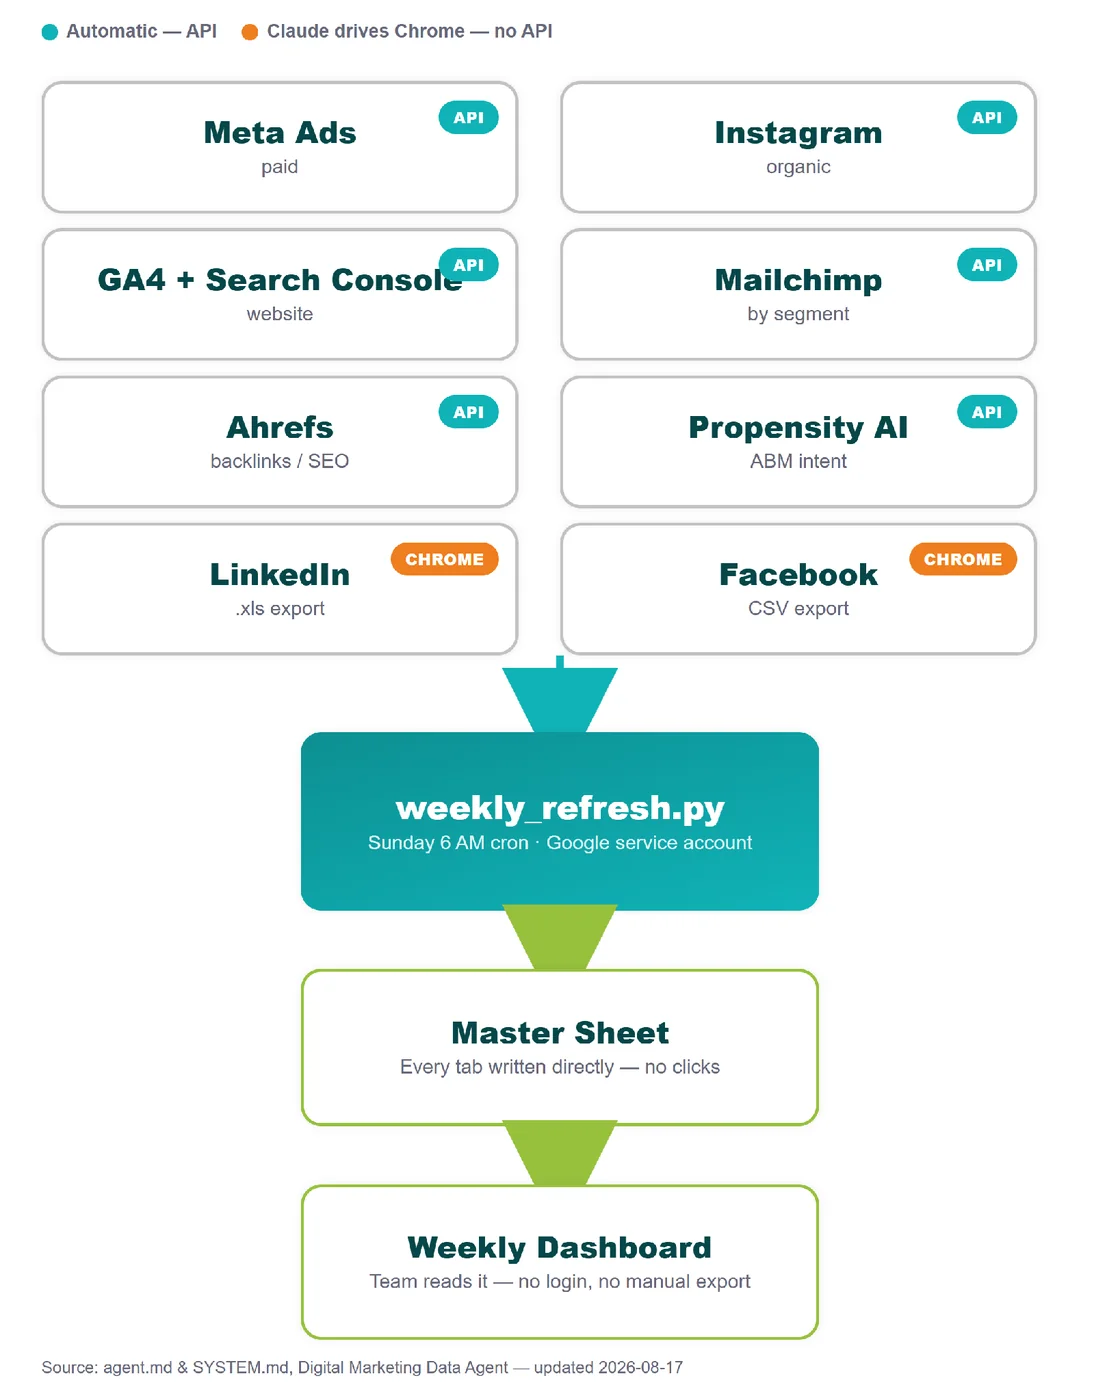
Every source, one sheet, every week
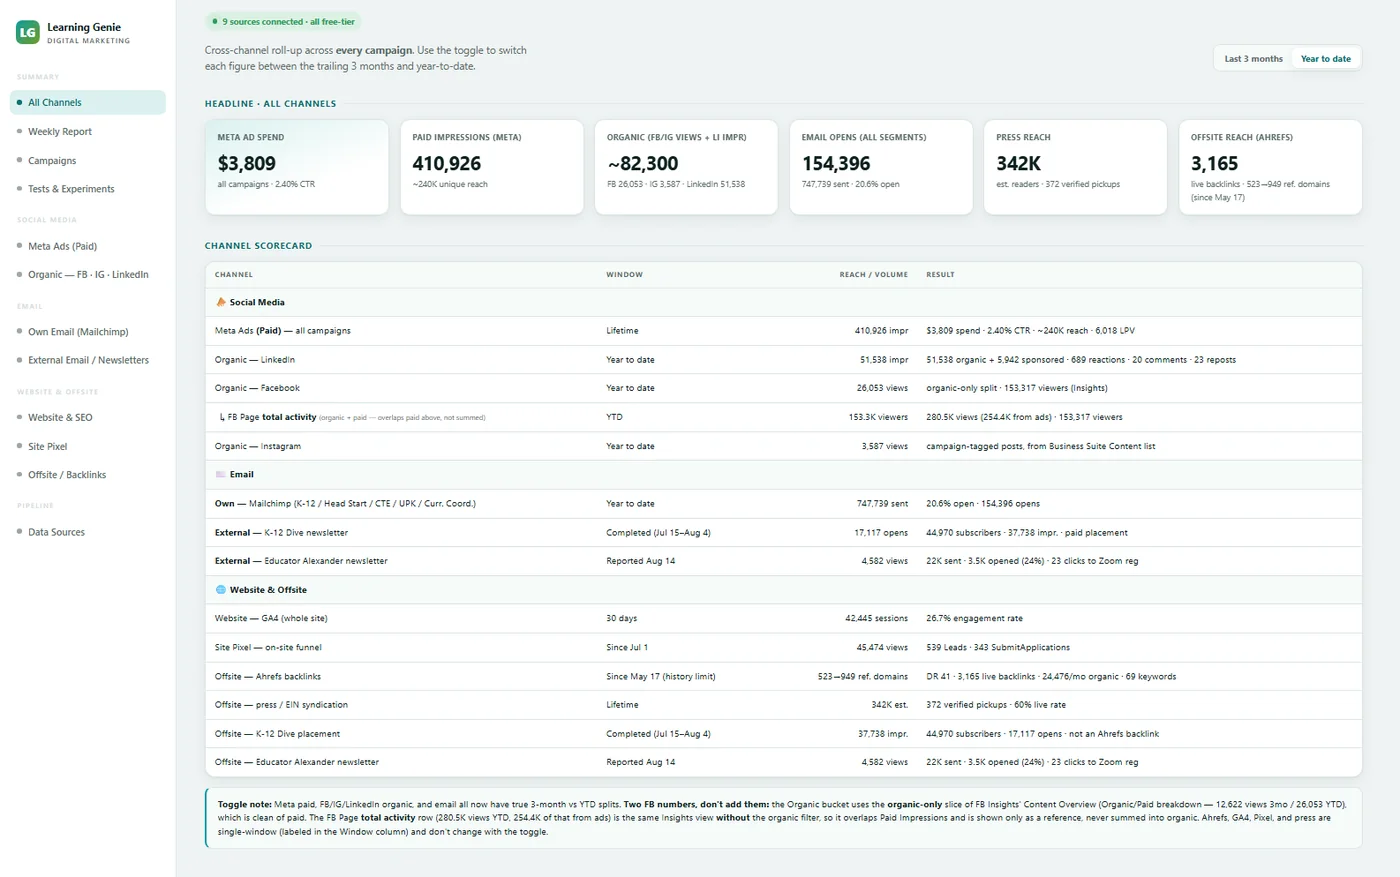
A weekly pipeline pulls Meta, Instagram, GA4, Search Console, Mailchimp, Ahrefs, Propensity, LinkedIn and Facebook into one shared sheet and dashboard. It replaced a paid reporting subscription.
Social Media
Learning Genie: organic growth
Last 90 days vs. the 90 days before, with no ad spend behind these numbers.
FB Analytics
Growth on the Facebook page I managed, from the platform's own analytics.
IG Analytics
Growth on the Instagram account I managed.
Paid Campaigns Led
Aug – Nov 2024, ASSIST. Two content pillars, each with its own goal.
Content pillar: Brand Awareness
The campaign's CPM of ₱7.29 was well below the industry average of ₱30, and a 5.38% engagement rate beat typical benchmarks.
Content pillar: Community Building
The larger reach cost more per impression but still delivered strong visibility, with meaningful interactions at a 1.08% engagement rate.